This is part of my notes taken while studying machine learning. I’m learning as I go along, and may update these with corrections and additional info.
Linear regression is used for Supervised Learning Regression models. Regression models answer the question: How much? Examples:
- How much does this house cost?
- How many seconds do we expect someone to watch a video?
Given a set of data we have already collected, such as sale prices and square footage of homes, we try to estimate the sale price of another home based on its square footage.
We do this by plotting the known data, and then trying to draw a line that best fits this data.
Here is an example of a linear regression where we have calculated a line based on values of peoples heights and weights.
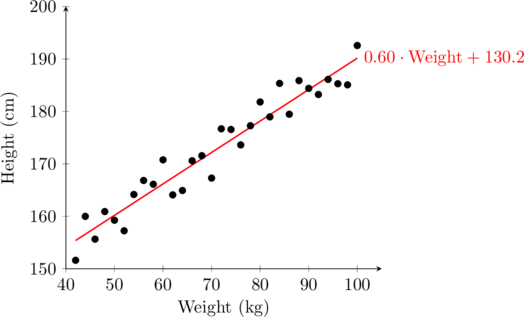
Estimate a Value
Now we can try to esimate a person’s height (y) given their weight. Let’s say we know a person weighs 75kg:
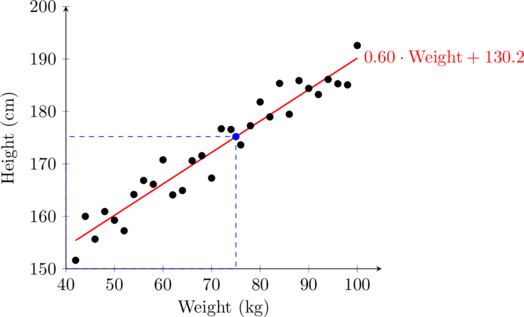
If we plot that on our line, we see that our model estimates a person 75kg to be about 175cm tall.
The Linear Regression Expression
We can draw a straight line on a graph like this:
y = mx + c
Where:
m = called the slop, gradient, or rate of change
c = where the line intercepts, or crosses, the y access. Also called the y-intercept, or starting value
We can also express this like this:
y = w1x + w2
This will be the basis of our linear regression equation.
Plotting the expression
If we plug in a couple of values for w1 and w2, like this: y = 0.4x + 1, then we can chart it on a graph:
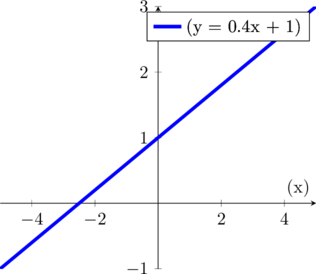
With our line plotted we see it going up to the right at our rate of change of 0.4. Or, or every unit of 1 we go horizontaly along the x axis, we go up 0.4. The line crossed the y axis at 1, which is our y-intercept.
Moving a Line to Fit our Data
Our linear regression line should be as close as possible to our data points. While normally we will have quite a few data points, we’ll just start with one to get the hang of things.
There are a few ways we can move the line one our graph:
- Adjust the y-intercept
- Adjust the slope
Adjust the Starting value: y-intercept
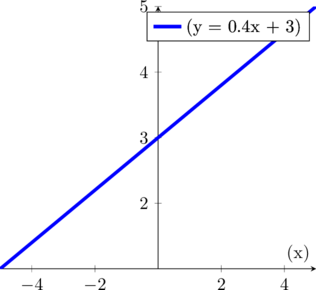
We can move the line up or down on the y axis by changing the value of the constant c or w2. If if our y-intercept is at 1, we can move the line up by changing it to a 3, such as y = 0.4x + 3
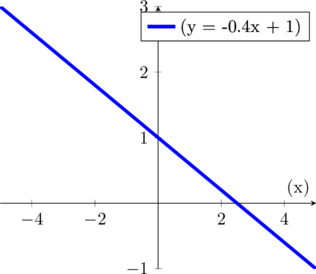
Adjust the slope: gradient
And if we want to change the angle of the line, we modify the gradient, m or w1. We can point it down with a negative number, such as y = -0.4x + 1
More Fitting Techniques
We know how to move the line on our graph to try to fit it best with our plots. We can improve on this a bit with a couple of tricks.
- Absolute Trick
- Square Trick
Next up, Absolute Trick for Fitting Linear Regression Models

You must be logged in to post a comment.