TL;DR Crash Analytics is both easy to implement and incredibly useful for debugging your Titanium apps. It will easily pay for itself with the development hours saved in tracking down bugs.
Intro
One of the cool things about being a member of the Titanium Titans user group, aside from getting to do fun interviews, is having the opportunity to try out new products and services from Axway.
I have been using Axway’s Amplify Platform as a mobile backend for apps for several years now, all they way back to when it was called Appcelerator Cloud Services. One of the things that has been on the wish list for the platform has been crash and exception logging. That itch was scratched this past spring when Axway released Crash Analytics, and I jumped at a chance to try it out.
The Test
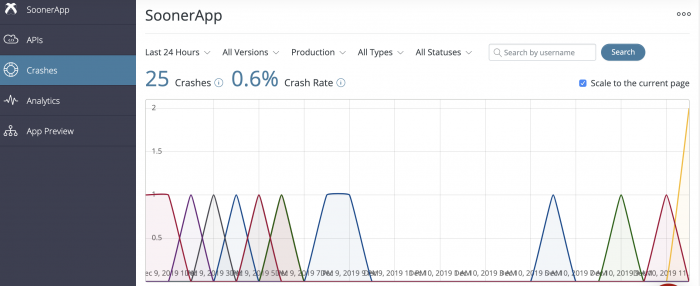
My usual process for trying out new functionality either in Titanium apps themselves, or in this case with the Platform, is to first try implementing it on a personal app before implementing it on a customer app or backend. My go-to Titanium app for the past 7+ years has been SoonerApp for iOS and Android, which is something I developed for fun and has turned into a pretty popular app among its target market (that being diehard football fans of a particular college team).
For my initial implementation, I did the bare minimum: I added the module to tiapp.xml and that was it. No additional work is necessary to start collecting crash data. No need to even require the module in code unless you need to use any of the CA module methods (more on those later), as the module initializes itself.
After adding Crash Analytics functionality to SoonerApp over the summer, it became pretty clear to me that CA was going to be a keeper (So why did I wait 6 months to right this blog post?!?) Right away, I was seeing errors that didn’t previously show up either in my own testing, or via the Apple or Android / Google Play crash reporting.
With both Apple and Google Play’s crash reporting, we usually only see some cryptic memory dumps or, slightly better, some Swift/Objective-C/Java stack traces which may or may not give us any clues as to what is wrong in our Titanium apps. Right away, Crash Analytics gives us a leg up; when we get a crash that originates somewhere in our JavaScript code, we’ll get a JavaScript stacktrace in addition to the native stacktrace. This means we’ll actually see what Alloy or Titanium classic code that is causing the error. Hooray!
So what did I see
Bugs! More specifically, bugs that I wasn’t able trigger on my own, at least not with any regularity. Some could be considered sorta edge cases, but get a large enough user base, and it is going to be enough to notice.
One case was with a 3rd party module that wasn’t working well under a given set of devices and OS levels. CA shows us the crashes, the stacktrace shows the spot in Titanium where it was happening, and the device / platform / os level details showed us that the issue was related to specific cases. And, of course, these were devices that I hadn’t tested on.
Another issue was occuring when an API the app uses was slow to respond. I had some error handling that wasn’t quite working right. And my testing wasn’t triggering the issue because the response time was never an issue in my environment.
More recently, I noticed that a recent build I did with a newer Titanium SDK to support Android 10 was affecting some older devices to hang at startup because the splash screen resolution was too high for their device. Now, that was a random one, but still affecting users. Ahh, the joys of having a bazillion different Android devices use your app.
The Case for Customers
Based on my testing, we felt confident that this would not only greatly benefit our customers and their apps, but their users as well. Not only that, the time it has saved in development and debugging can be pretty significant.
This fall, we’ve moved several apps to Crash Analytics, and in each case we find at least one ‘low hanging fruit’ of an error, that we can quickly turn around and fix with out much of a debugging effort. For one customer who upgraded their Amplify Platform subscription just to use Crash Analytics, the cost paid for itself just in development time.
6 Months In
After six months of use on both personal and customer apps, it is easy to recommend Crash Analytics. Here are things that I particularly like about it, as well as what I would like to see in future enhancements
What I Like
JavaScript Stacktraces – This is fantastic. For crashes that are based in Titanium code, this sends you right to issue. Not so easy, or even possible in many cases on Apple and Play crash reports.
Having a single spot for crash logging – Getting both Apple and Android errors in the same place is a time saver. Even more so if you are using Amplify’s other features with your apps, as you are in there already. Not always the case with having to dig into Xcode or Google Play console to see what’s up.
setMetadata and logHandledException methods – After initally just adding the module and seeing what shows up, we’ve expanded to make use of these two items especially. setUsername should draw honorable mention status, for apps that have user logins.
And what I would like to have
Additional Filtering – Currently, we can filter by time, app version, environment (dev, prod, test), type (crash or error) and status, which is a user managed triage for each error message. We can also search by username.
I’d like the ability to filter by Platform, such as iOS and Android, OS level, as well as be able to specify a range of app versions, such as with a multi-select.
Filtering by iOS/Android would be especially helpful, as oftimes we have cases where we are actively working on say just the iOS version of an app, and Android tends to generate a lot more errors, and the iOS errors can get lost in the mix.
Integration with Issue Trackers – Being able to link to Github Issues, Jira, etc, would be fantastic.
Screengrabs – Had this in a previous product. While pricey, it was pretty helpful. A guy can dream.
Conclusion
- For current Titanium users, the product is simple to set up and use, especially if you are already using Amplify Platform for your apps.
- For apps of any size, the cost of the service will quickly be recouped with saved development and debugging time, not to mention more happy users!
- This isn’t a replacement for QA and testing, and it is not meant to be. And there are always going to be bugs. This is a great tool for catching more of them.
More Info
You must be logged in to post a comment.